With as many as 76% of marketers planning to produce more content in 2017, it becomes critical to weigh the performance of content campaigns against goals.
Sadly, most marketers see this as a challenge. 57% marketers state measuring the effectiveness of their content as one of their top 5 content-related challenges.
To overcome this, it is imperative for the marketing plan to be able to measure the success of their content. However, this isn’t as simple as it sounds. When trying to gauge the ROI of your content, you can’t rely on a single conversion point.
There are a lot of metrics you must dig into. Thus, we have compiled a list of key metrics (in no particular order of importance) that you should pay heed to while evaluating the overall performance of your content marketing program.
1. Consumption – The who, where, and how of your content
The moment you hit the publish button, your content travels in different directions. It may reach a lot of audiences, or it may reach none. In either of the cases, you’ll come to know about the reach of your content. What is its consumption rate? Are people looking at it as much as you want them to? If yes, then is it engaging? On which platform your content is performing the best? Is there a particular geographical region where it’s being read more often, or not at all?
You can find these answers about the consumption of your content by evaluating the following metrics –
1.1 Pageviews
Imagine blog post ‘A’ gets 200 views per day while blog post ‘B’ gets merely 30 views in a day. Does this mean ‘A’ is performing better than ‘B’? Not really. The overall performance of a content piece is determined by various factors such as a call to action click through, the number of leads generated etc. (which we’ll be discussing further in the post). Page views tell you only about the reach of your content.
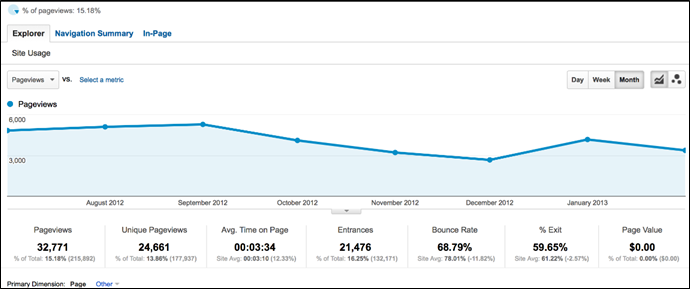
You can compare this to the number of views a movie trailer gets. It may go up to a couple of millions but the same movie may get a lukewarm response at the box office. However, it did create a buzz. Same goes with the page views. They translate into the kind of buzz your content has created amongst the audience.
So, what happens if the page views are low? Is the article a dud? Again, no. It simply means it did not reach as many people as you intended, which could be because of a multitude of reasons – you’re not promoting your content enough, your SEO game isn’t on-point, or you are targeting the wrong audience.
How to Track It – Log into your business’ Google Analytics account and go to the reporting section. Now go to Audience and click on Overview. You’ll find the page views upfront on the dashboard.
1.2 Bounce Rate
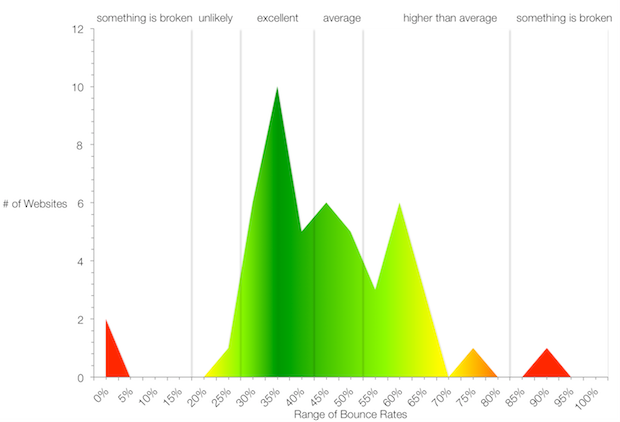
Bounce rate refers to the number of people who’ve left your site after accessing a page, without engaging further with the website. So a 60% bounce rate means 60% of visitors who landed on the page left your website without interacting with any other pages. So, is a high bounce rate always a bad thing? Not necessarily. It depends on the purpose of the page. Generally, a bounce rate in the range of 26 to 40 percent is excellent. 41 to 70 percent is average, and anything over 70 percent is disappointing.
How to Track It – On the Google Analytics dashboard click on Audience and then Overview. Select Bounce Rate from the drop down.
Pro Tip – You can compare your bounce rate with other metrics like pageviews, new sessions, average session length etc. This will give you better insights. For instance, if a page gets hundreds of pageviews every day, but the bounce rate is more than 80%, it means the content on that page isn’t engaging enough. Similarly, if both the pageviews and bounce rate are low, it means your content is doing the job of hooking the readers; you now need to work on your distribution strategy to get more people to see the content.
1.3 Average Time on Page
Average time on page is one metric that brings context to your bounce rate statistics. Instead of fussing about the high bounce rate of a page, you should focus on the average time a user is spending on the page. This is especially true if you have designed a piece of content with the purpose of keeping your audience informed. In this case, it is alright for them to spend a considerable amount of time reading that content piece rather than browsing the website aimlessly.
This metric can also throw some light on the relevancy of the content for your audience. It tells you whether your audience finds your content relevant, and is interested in reading it. In some cases, such as below, the time spent on a particular page can be more than the average time spent on the site. This means that particular content is performing particularly well, and can be used as a benchmark for future content creation.
What is a good average time on page? Well, it depends on from site to site. Honestly, you’ll have to figure this out using intuition for each of your pages. However, if someone is spending, on average, 30-45 seconds on a page, consider that a good start.
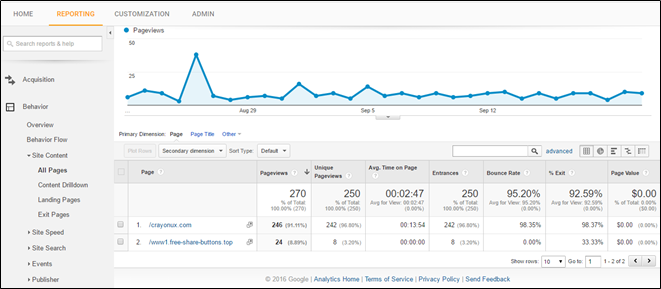
How to Track It – In Google Analytics, go to Behaviour, click on Site Content and then All Pages.
Pro Tip – To get a more precise look at the performance of your content, you can create an advanced segment. This helps you split up particular types of traffic within your Google Analytics reporting. Courtesy – Digital Marketing Institute
2. Engagement – What is the level of engagement for the content you produce
Beyond general brand awareness lies genuine engagement and interaction. In a study, 55% marketers stated ‘improving customer engagement’ as one of the top priorities of content marketing programs. To track your progress towards this goal of customer engagement, it’s important to monitor these following metrics –
2.1 Number of Comments on Post
Evaluating this metric is rather simple. If your focus is to create highly engaging content, comments can show you the real picture. If a content piece has a high number of comments, it means it is highly engaging and has been of value for the readers. But not always. It depends on the nature of comments. If they’re all negative, you gotta go back to ground zero of your content strategy and see what can be done better. But if it’s all good, it means your content team is working their asses off for the right reasons.
Comments also make up for a great feedback mechanism. It tells whether the content is written in a voice that resonates with your audience, answers the questions they have, do they really want to see/read something like this, are they likely to share it in their network etc. What’s more? You can find some awesome content ideas from what your readers comment. It’s the best alternative to a real-time human interaction that gives you an intuitive sense of your audience. No amount of keyword research or competitors’ analysis can do this.
How To Track It – If you have a Wordpress, Tumblr or Blogger, you already have an in-built comments mechanism. To filter spam, you can use plugins like Akismet and Mollom. Alternatively, you can try Facebook Comments. This commenting mechanism needs readers to be signed into their FB accounts while commenting. They can comment from personal profiles or as a business page. This gives you the opportunity to know the people who are engaging with and commenting on your posts. Besides, readers have the option of posting comments on Facebook, which ensures that your post is shared with their audience.

Another great commenting system is Disqus. After readers comment on a post using Disqus, they get an email notification on any new comment on that post. This keeps bringing your audience back to the post. Readers can also tag other people in Disqus comments, which means greater engagement.
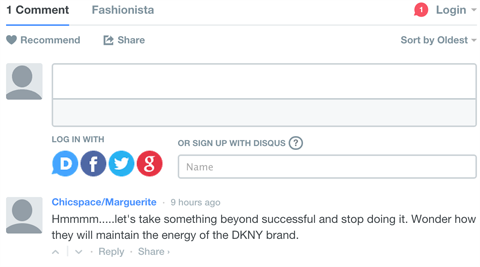
However, just having a robust commenting system is not enough. You must respond to your audience and engage them. Reply to comments regularly, whether negative or positive. And keep an eye on any interesting suggestions your readers share. These can be your future blog topics.
Pro Tip – Want more and more people to comment on your post? These 14 tips by Jon Morrow can come handy!
2.2 Social Comments/ Shares/Increase in Followers
The total number of comments/likes/shares across different social platforms have a significant weight age when you are trying to gauge the awareness and exposure your content brings.
Shares – This includes repins, retweets, and any other metric that tells about the reach of your content and the fact that your audience loves it!
Social Comments – This works just like the comments on your blog. If a reader has taken the effort to leave a comment on the post you’ve shared (or mention you, in the case of Twitter), it means you’ve struck the chords right.
An increase in Page Likes/Followers – New followers on Instagram/Pinterest/Twitter or more page likes on Facebook mean your content is awesome! After all, your audience is making a conscious decision to receive updates of what you’re posting.
Note – Each of these social metrics is independent and tells a story about content engagement, however, in some cases their weight age may vary depending on the social channel in question. Here’s an example –
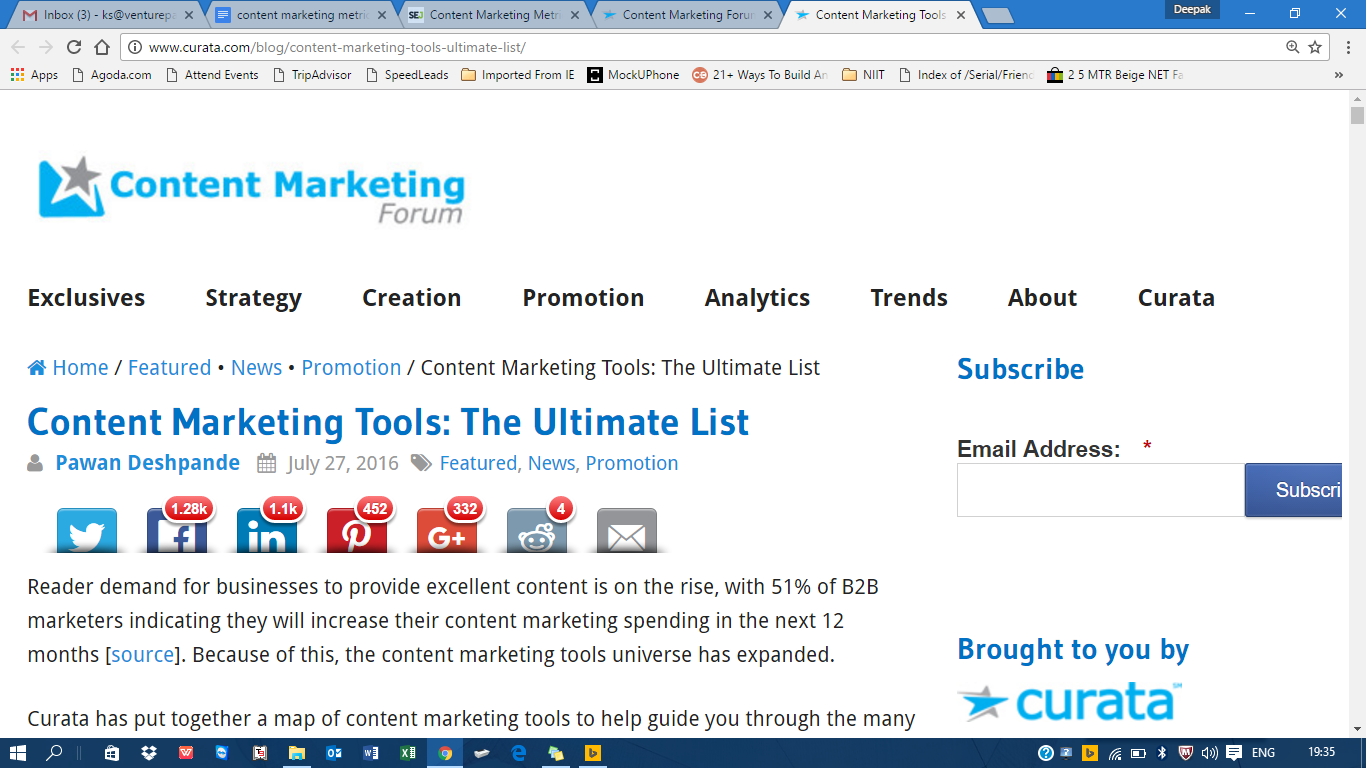
Facebook wins hands down when we look at the buzz this post created. However, when measuring engagement, we look at LinkedIn. It’s a professional network where people are more interested in reading interesting content than in just skimming through headlines on the timeline. Thus, not only is it more difficult to get 1.1K shares on LinkedIn than it is on Facebook, but it also brings more effective engagement.
How to Track It – We recommend you to do a channel-wise audit to understand the real picture painted by these social metrics. Manually, it’ll cost you both time and resources. Yes, you can use Google Analytics, but you’ll only get a high level overview. If you want to track things like backlinks from social channels or see which other sites/pages are sharing your content, it’s best to make use of the various available social media analytics tools. We recommend Buzzsumo, HootSuite, Socialbakers, and Buffer.
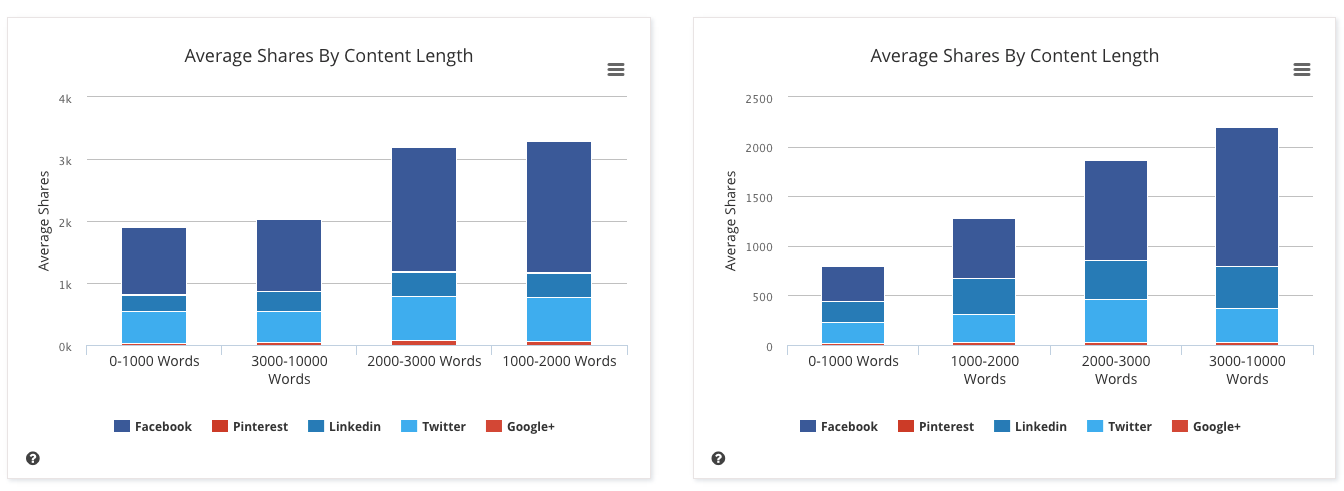
Pro Tip – Tracking the metrics alone won’t help. You need to tie them to goals and action items. For instance, if a particular post has received loads of likes but no comments, figure out why that’s happening. Maybe, you have not added a CTA that encourages them to comment. Or your content visuals are good, but the copy isn’t engaging enough for them to comment or start a conversation. On the other hand, if a content piece is going viral, it means it’s resonating with your audience. Use it as a benchmark, and make inspire your team create similar, awesome pieces.
2.3 CTA Click Through Rates
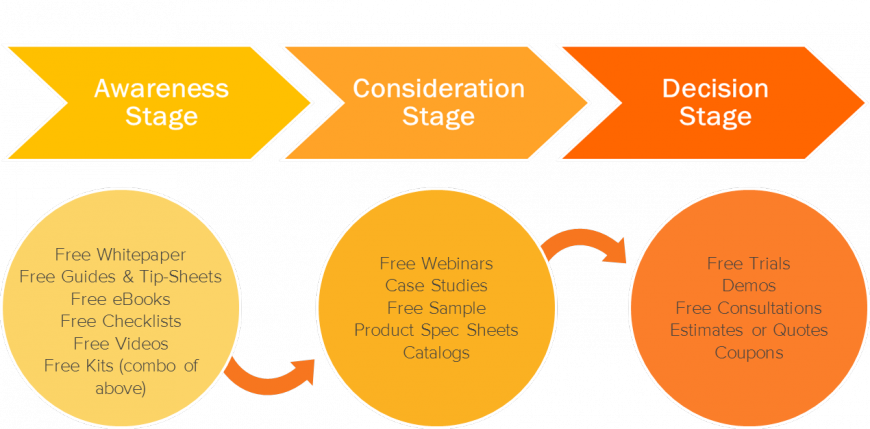
Content marketing used to engage prospective leads and help them move further in the conversion funnel. And how do you guide them towards the next step? Call to Actions! For instance, if you’ve created an infographic that talks about the future of interactive content marketing, offer readers the possibility to read another blog post about “Awesome interactive content examples” or take them to that section on your website that hosts ebooks about interactive content.
It is critical to connect all your content with relevant lead generation pages/tools/avenues. The click through rate of your CTAs will show if your content is relevant and whether you’ve designed the content funnel right. It is important that the content you create is mapped to lead nurturing content at each stage in the sales cycle.
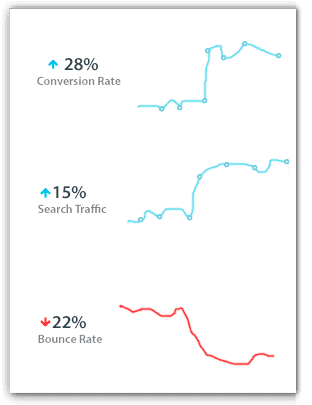
Pro Tip – Higher clickthroughs are a definite sign of engagement. One of the best ways to make content more engaging is to make it interactive. Interactive content gets 50% more click rate and 13% more shares. VenturePact, a SaaS firm, saw 66% clickthrough rate for a mobile app calculator they hosted on their site.
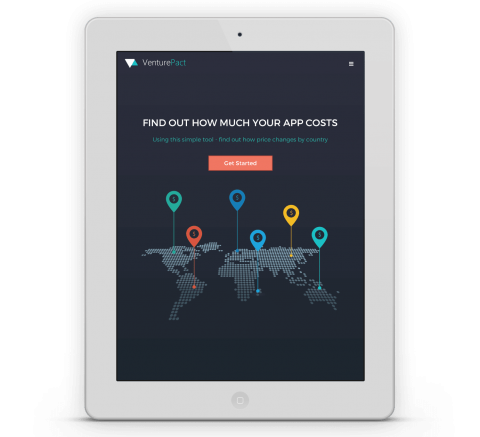
Including assets like calculators and quizzes help you make your content more engaging and improves its ROI. Learn more about optimizing the ROI of your content using the interactive content here.
How to Track It – You can measure CTA click-through rates on Google Analytics, but the method requires technical know-how and doesn’t give intuitive insights (here’s a step-by-step guide in case you want to give it a try). We recommend Hubspot Marketing tool. It lets you easily set up relevant call to actions and measure their performance. Here’s more on analyzing CTAs using Hubspot.
3. Conversation – Are you being talked about?
Is your brand the talk of the town? Or is it one of the many lost names in the industry? Is your content able to get your name out and about?Does your audience talk about you? The following metrics can help you know.
3.1 Referral Links
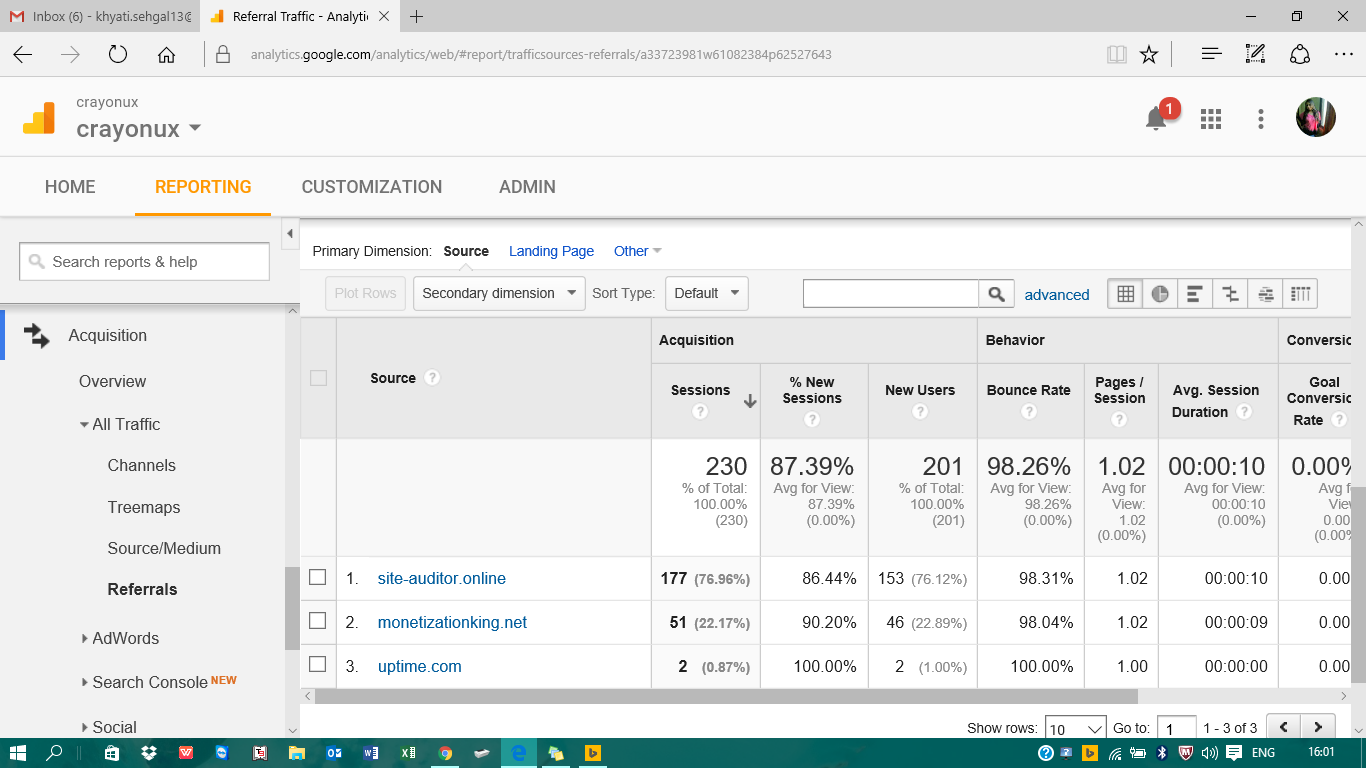
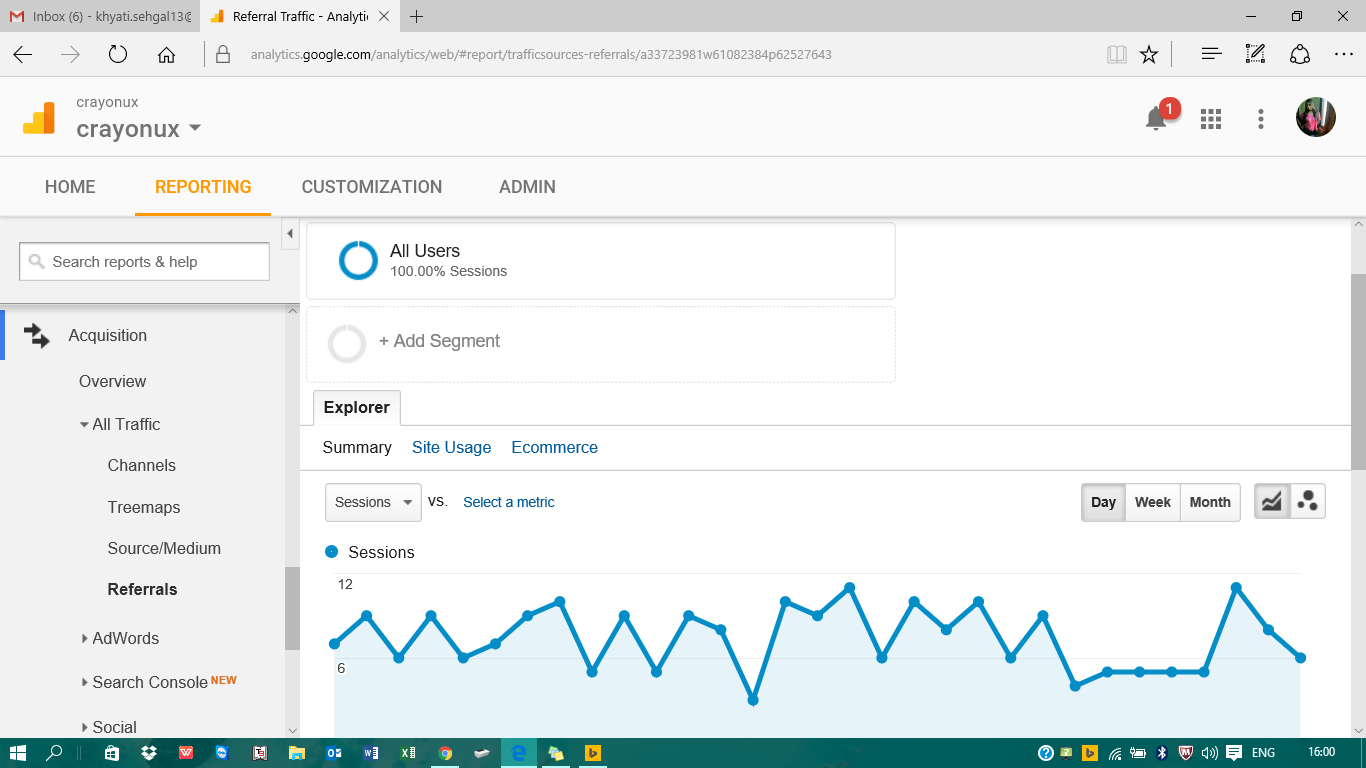
Sure, this isn’t a metric to live or die by. Not all your content pieces are going get a significant volume of outside links, but those that do can open the door to umpteen content promotion opportunities. Keeping a track of referral paths can reveal future guest posting or content curation opportunities, and help you connect with influencers and other thought leaders in your industry. An increase in the number of inbound links is also indicative of the popularity of your content amongst the audience. So if certain topics are getting more natural outside links than others, take a note. It can be a pattern, revealing about the topics that resonate most with your customers.
How to Track It – In Google Analytics, go to the Acquisitions section and click on All Traffic and the Referral. This will give you an insight into the sites from where you’re getting referral links.

3.2 Mentions
It is important to track brand mentions all over the web including social platforms. The number of mentions reveals how well your audience is receiving your content and what do they have to say about it. After all, what people say about you is what defines your brand’s worth. Thus, it’s important to keep a track.
For instance, the brand Kissmetrics has been mentioned on the web more than 100 times last week. What does this mean? Their content is spreading like wildfire and their brand is growing every single day.
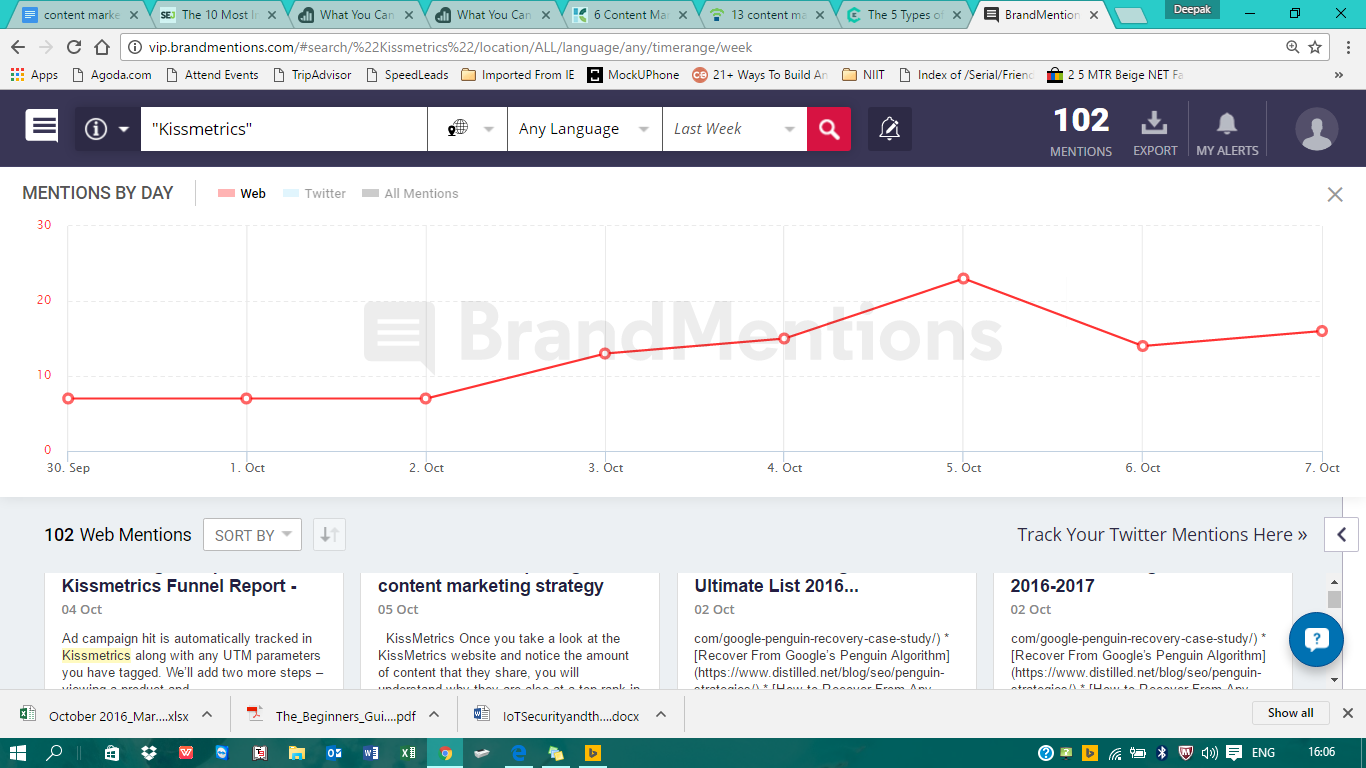
Once you have the relevant metrics in hand, you can figure out which pieces of content have performed well. You can then reach out to the authors and network with them for future collaboration possibilities.
How to Track It – You can set up Google Alerts for your brand. This way whenever someone mentions your brand, you’ll get an email notification. However, if you want to get a comprehensive report of all the mentions across all platforms, you can use tools like BrandMentions and Mention. For social mentions specifically, you can try Social Mention and #tagboard.

4. Conversion – Is your content converting?
Besides engagement, conversion is the other big goal of content marketing. Without conversion, content creation is aimless. Thus, it is important to track whether your content is converting. Have there been enough sign ups? How many leads did that content piece generate? Did the leads convert? What was the conversion rates? However hard they may sound, every marketer ought to ask these questions, and find answers to them. Here are some metrics that you must track in order to have a clear conversion picture.
4.1 Total Lead Attribution
We can’t emphasize enough on the importance of tracking leads. Lead generation is one of the top goals of any content marketing campaign. After all, leads are the lifeblood of a business, without them no business can thrive. To effectively track this metric, you need to look at the number of leads generated from form submissions, trial signups, offer opt-ins, and email subscriptions. However, to get the real business picture, you should focus on the number of qualified leads generated by a piece of content.
“Many companies measure a marketing campaign’s success off of leads. Our most successful campaigns produce a low number of leads, but a high percentage of qualified leads. We have a team member who goes through leads that comes through our website and determines if it is high quality or not. She then reaches out to those people individually instead of just leaving them on an email drip campaign” says Kelsey Meyer, Influence & Co.
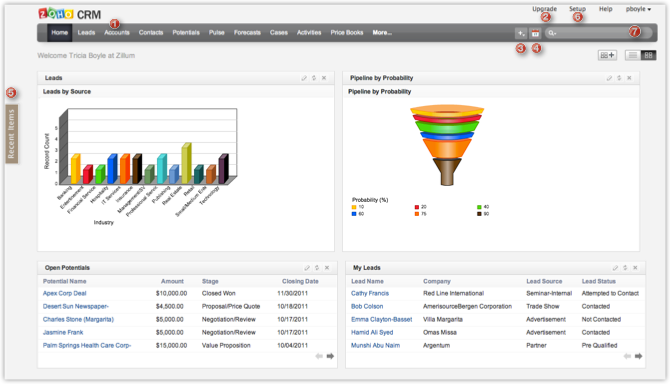
How to Track It – A CRM can easily help you track and attribute leads to your content marketing campaigns. You can also track the source of leads right from the moment the enter the sales funnel till the point they become a customer. This will help you monitor the content they consume on the way and the content that converts the most. Some popular CRMs you can use are – Hubspot, Zoho, and Capterra.
4.2 Conversion Rate
Here’s how conversion rate is calculated –
Total No. of Conversions / Total No. of Ad Clicks that Can Be Tracked to a Conversion
Simply put, the conversion rate is the measure of whether people take the action you want them to take with your content – it could be a simple share on a social media platform or a form submission to download an ebook. It is good to keep a track of the conversion rate to know whether or not your content is converting into valuable information that you can use (email address, sales lead etc.) A good conversion rate varies depending on the industry you are in and the channels you are targeting. According to Teknicks, for inbound marketing campaigns, 1-3% is a good average.
How to Track It – Google analytics can come handy for setting up and tracking conversion. Here’s a detailed article about this.

 About the Author
Khyati Sehgal is the content innovator at Outgrow. When she isn’t helping, marketers create some awesome interactive content, you’ll find her in the nearest Starbucks with her latte and a Sidney Sheldon.
